Note
Go to the end to download the full example code.
Read a result file#
pyvista_frd.read() returns a pyvista.UnstructuredGrid. Nodal
results are stored as point data and work with standard PyVista filters.
The file here is a cantilever: 600 linear hexahedra fixed at one end and loaded at the other, solved by CalculiX 2.22.
Read the first result step.
mesh = pyvista_frd.read(DATA / 'cantilever.frd')
mesh
DISP and STRESS come from the file. The reader derives the _Mises
and _PS* arrays from the stress tensor.
for name in mesh.point_data:
    array = mesh.point_data[name]
    print(f'{name:16s} {array.shape}')
original_node_ids (900,)
DISP             (900, 3)
STRESS           (900, 6)
STRESS_Mises     (900,)
STRESS_sgMises   (900,)
STRESS_PS3       (900,)
STRESS_PS2       (900,)
STRESS_PS1       (900,)
TOSTRAIN         (900, 6)
TOSTRAIN_Mises   (900,)
TOSTRAIN_sgMises (900,)
TOSTRAIN_PS3     (900,)
TOSTRAIN_PS2     (900,)
TOSTRAIN_PS1     (900,)
ERROR            (900,)
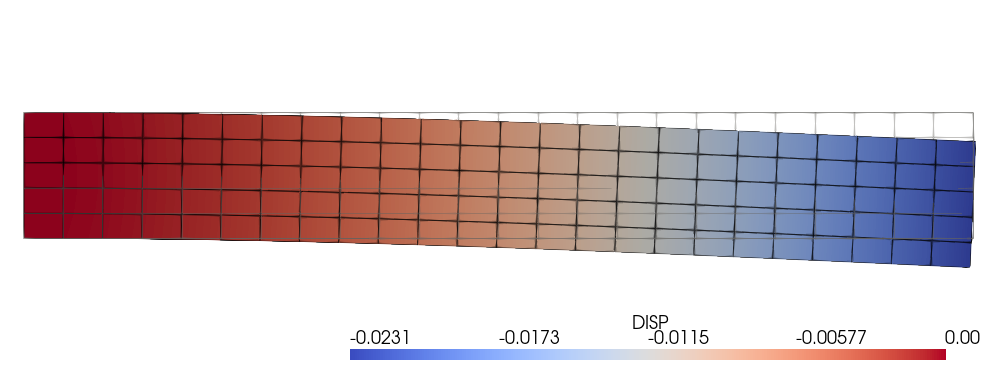
Plot displacement on the deformed mesh. A factor of 200 makes the small displacement visible.
warped = mesh.warp_by_vector('DISP', factor=200)

pl = pv.Plotter(window_size=(1000, 380))
pl.add_mesh(warped, scalars='DISP', component=2, cmap='coolwarm', show_edges=True)
pl.add_mesh(mesh, style='wireframe', color='grey', opacity=0.3)
pl.camera.tight(padding=0.05, adjust_render_window=False, view='xz')
pl.show()
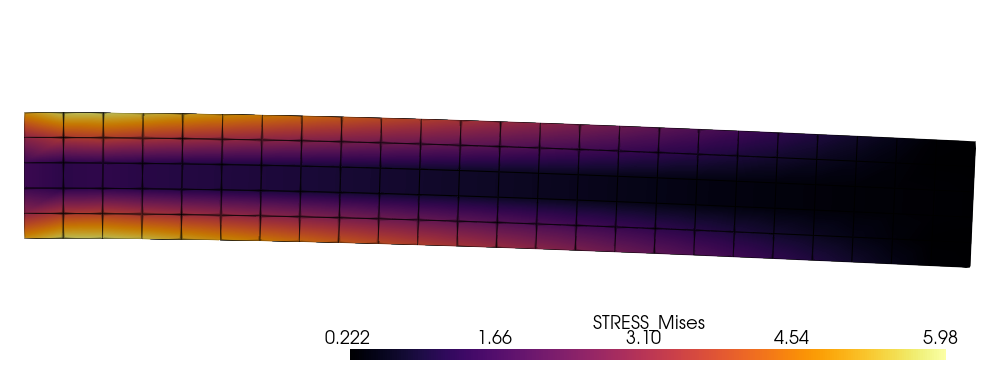
Apply a standard PyVista clip to the same mesh.
pl = pv.Plotter(window_size=(1000, 380))
pl.add_mesh(warped.clip('y'), scalars='STRESS_Mises', cmap='inferno', show_edges=True)
pl.camera.tight(padding=0.05, adjust_render_window=False, view='xz')
pl.show()
Total running time of the script: (0 minutes 2.370 seconds)