Note
Go to the end to download the full example code.
Step through a multi-step file#
An FRD file stores one result block per step. pyvista_frd.FRDReader
implements PyVista’s TimeReader interface.
The file here is a modal analysis: CalculiX writes one step per mode, and the “time value” of each is the natural frequency in Hz.
List the available modes.
print(f'{reader.number_time_points} steps')
for i, value in enumerate(reader.time_values):
    print(f'  mode {i + 1}: {value:10.2f} Hz')
4 steps
  mode 1:     755.57 Hz
  mode 2:    4406.90 Hz
  mode 3:    5008.47 Hz
  mode 4:    8669.44 Hz
Select and read one step. Opening the file indexes each result block; values are parsed when their step is first requested.
reader.set_active_time_point(0)
first = reader.read()
print(f'mode 1 peak displacement: {first.point_data["DISP"].max():.4f}')
mode 1 peak displacement: 9.7822
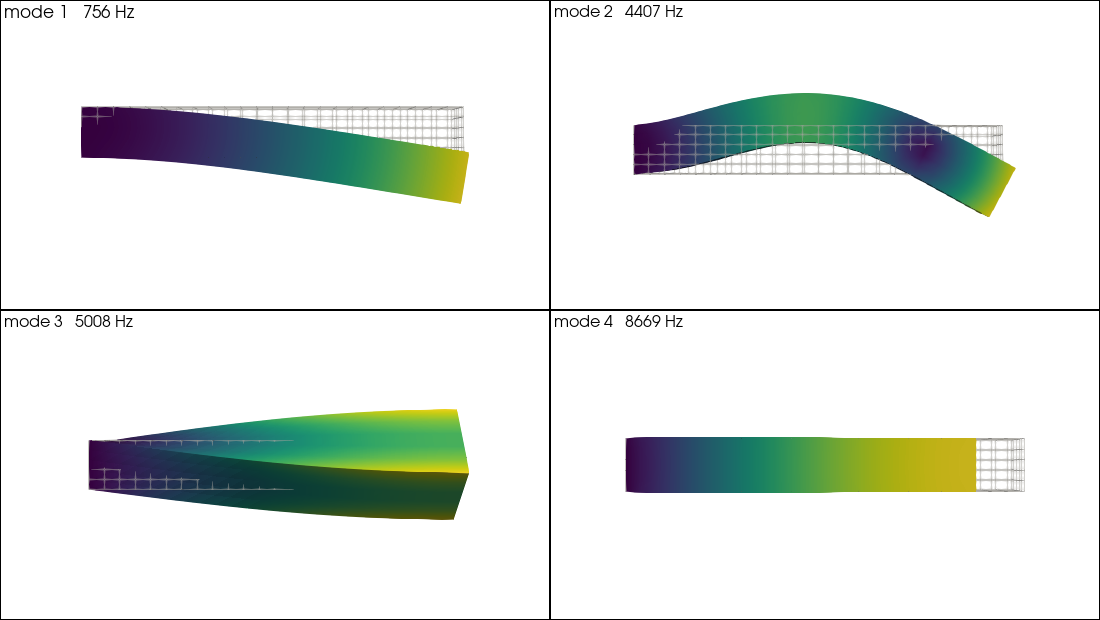
Plot each mode on its deformed shape.
pl = pv.Plotter(shape=(2, 2), window_size=(1100, 620))
for index in range(reader.number_time_points):
    reader.set_active_time_point(index)
    mesh = reader.read()

    # Each eigenvector has arbitrary amplitude. Scale every mode to the same
    # fraction of the beam length.
    peak = np.linalg.norm(mesh.point_data['DISP'], axis=1).max()
    warped = mesh.warp_by_vector('DISP', factor=0.12 * mesh.length / peak)

    pl.subplot(index // 2, index % 2)
    pl.add_text(f'mode {index + 1}   {reader.time_values[index]:.0f} Hz', font_size=9)
    pl.add_mesh(warped, scalars='DISP', cmap='viridis', show_scalar_bar=False)
    pl.add_mesh(mesh, style='wireframe', color='lightgrey', opacity=0.4)
    pl.view_xz()
    pl.camera.zoom(1.3)
pl.show()
Select by value instead of index. The value must match a stored step exactly.
reader.set_active_time_value(reader.time_values[-1])
print(f'active step is now {reader.active_time_value:.2f} Hz')
active step is now 8669.44 Hz
Total running time of the script: (0 minutes 0.275 seconds)